
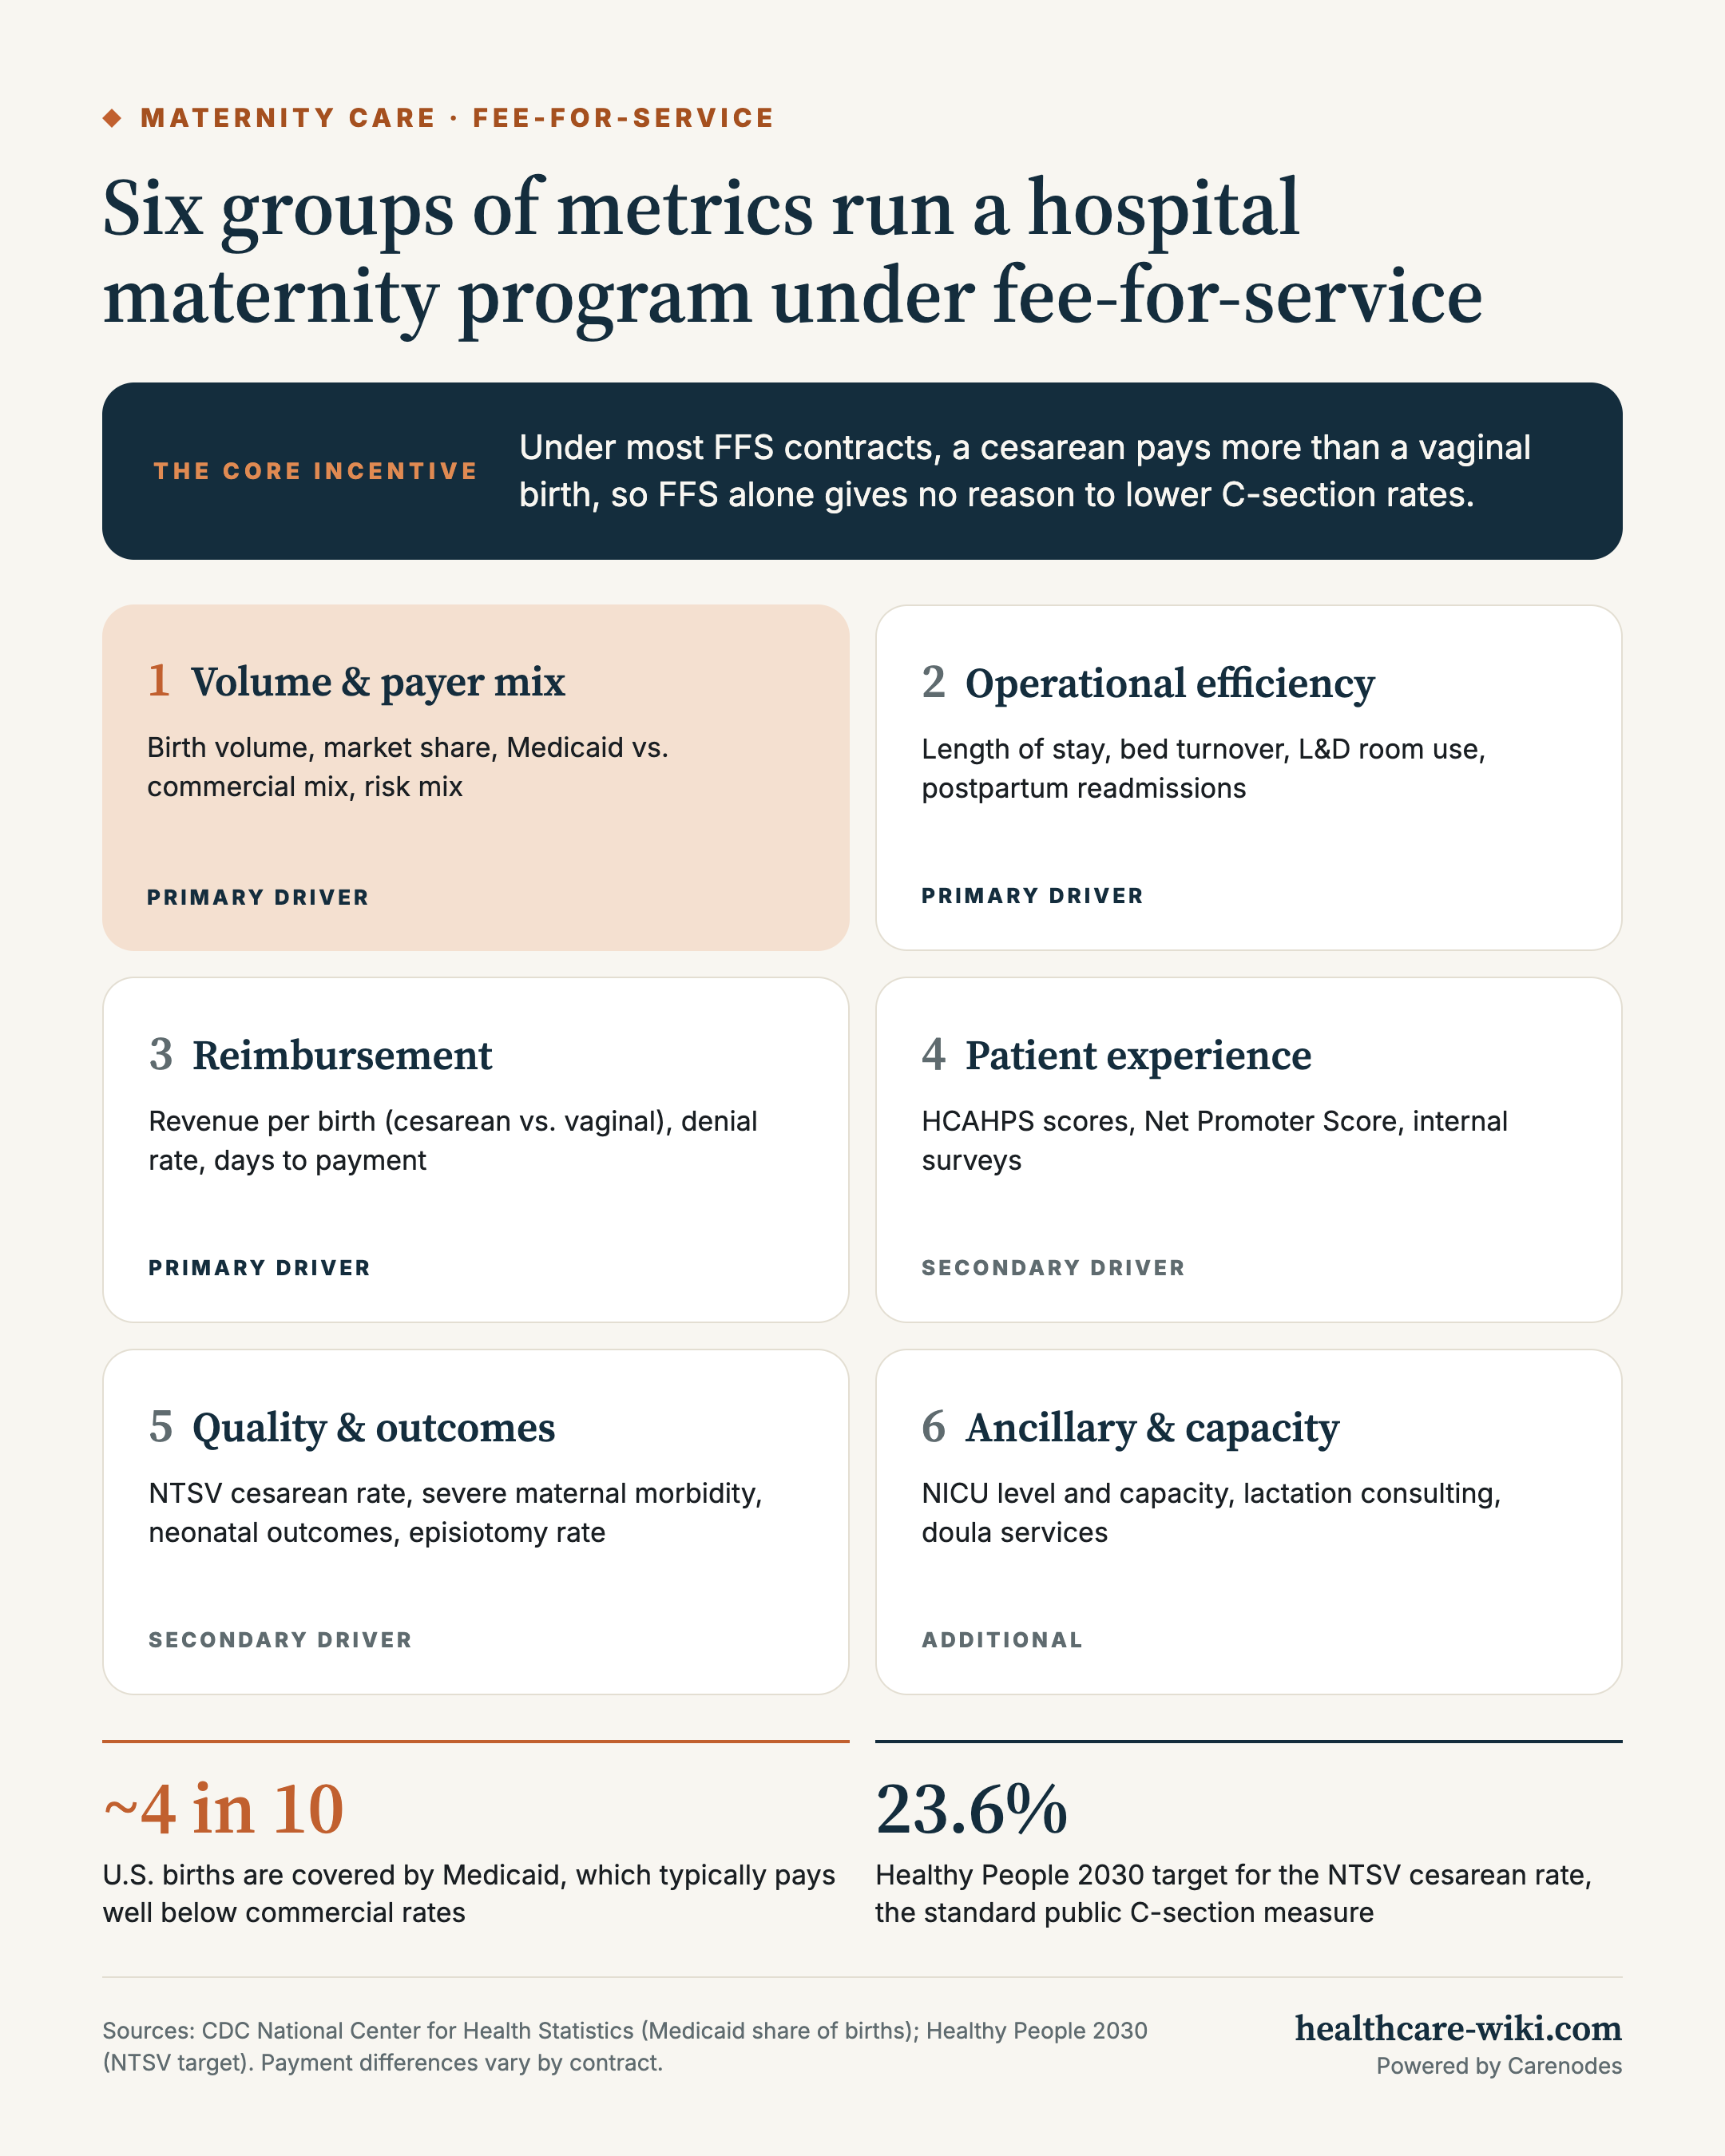
Most hospital maternity programs in the U.S. are still paid on a fee-for-service (FFS) basis: the hospital is paid for each delivery and each service, not for the overall health of the mother and baby. That payment model shapes which numbers hospital leaders watch most closely.
This guide is for hospital administrators, health plan contracting teams, and maternal health organizations who want to understand how a maternity service line is measured and managed under FFS, and where those incentives fall short.
One incentive sits underneath much of what follows: under most FFS arrangements, a cesarean delivery pays more than a vaginal birth. FFS on its own gives a hospital no financial reason to lower its C-section rate, which is why quality reporting, accreditation, and value-based programs have become the main pressure on that number.

1. Volume, market share, and payer mix
| Metric | Description | Why it matters |
|---|---|---|
| Total birth volume | Annual deliveries | Primary revenue driver |
| Market share | Share of total births in the region | Competitive position and referral strength |
| Payer mix | Share of births covered by Medicaid, commercial plans, and self-pay | Medicaid covers roughly four in ten U.S. births and typically pays well below commercial rates, so payer mix can matter as much as volume |
| Risk mix | Proportion of high-, medium-, and low-risk births | Higher-acuity births bring higher reimbursement and require more specialized capacity |
2. Operational efficiency
| Metric | Description | Why it matters |
|---|---|---|
| Average length of stay (ALOS) | Average inpatient days per maternity episode | Cost control and throughput |
| Bed turnover rate | How quickly maternity beds are used and freed up | Capacity optimization |
| Labor and delivery room utilization | Share of time L&D rooms are in active use | Facility efficiency |
| Postpartum readmission rate | Unplanned readmissions within 30 days after delivery | Efficiency and quality signal; affects reimbursement indirectly |
3. Reimbursement and revenue cycle
| Metric | Description | Why it matters |
|---|---|---|
| Revenue per episode | Average payment per birth, tracked separately for cesarean and vaginal deliveries | Revenue per birth, and the clearest view of the C-section payment gap |
| Initial denial rate | Share of maternity claims denied on first submission | Revenue cycle efficiency |
| Days to payment | Average time from claim submission to payment | Cash flow |
4. Patient experience
| Metric | Description | Why it matters |
|---|---|---|
| HCAHPS scores | Standardized, publicly reported patient experience ratings | Reputation and public comparison |
| Net Promoter Score and internal surveys | Likelihood patients would recommend the hospital, plus service-specific feedback | Expectant parents choose where to deliver, so experience drives future volume |
5. Quality and outcomes
Under FFS these are indirect drivers: they don’t change the payment for a given birth, but they shape reputation, referrals, and future contracts.
| Metric | Description | Why it matters |
|---|---|---|
| NTSV cesarean rate | C-section rate among first-time mothers with a single, head-down baby at term (the Healthy People 2030 target is 23.6%) | The standard publicly reported C-section measure used by Leapfrog, CMS, and The Joint Commission |
| Severe maternal morbidity | Serious complications such as hemorrhage, infection, or emergency hysterectomy | Safety, reputation, and referrals |
| Neonatal outcomes | Unexpected complications in term newborns and NICU admission rates | Quality reputation and future contracting |
| Episiotomy rate | Share of vaginal births involving an episiotomy (Leapfrog standard: 5% or less) | Widely used quality benchmark |
6. Ancillary services and capacity
| Metric | Description | Why it matters |
|---|---|---|
| NICU level and capacity | Level of neonatal care offered and available beds | Determines which high-risk pregnancies a hospital can accept, which affects referrals and leverage with payers |
| Lactation consulting uptake | Share of mothers who use lactation support | Better breastfeeding outcomes and incremental service revenue |
| Doula services utilization | Use of doula and other birth support services | Competitive differentiation and patient experience |
Why hospitals still work to lower C-section rates
Even without financial risk tied to outcomes, many hospitals actively work to reduce unnecessary cesareans. The main reasons are accreditation goals such as Baby-Friendly designation, patient safety and satisfaction, public reporting through Leapfrog and CMS Care Compare, and preparation for value-based contracts as Medicaid programs and managed care plans tie more payment to quality measures.
How these metrics show up in payer contracting
These numbers aren’t only internal management tools. When a hospital negotiates rates with a health plan, birth volume, market share, NICU capability, and quality results are its leverage. A hospital with strong NTSV and maternal morbidity results, a high-level NICU, and a large share of regional births is in a much better position to negotiate higher rates or move into value-based arrangements on favorable terms.
Payers are also using the same data more often. As Medicaid programs and managed care plans add quality incentives to maternity contracts, hospitals that already track these metrics well are better placed to earn those incentives instead of being penalized by them.
Summary
Under fee-for-service, the primary drivers of a hospital maternity program are birth volume, payer mix, revenue per episode, operational efficiency, and billing accuracy. Patient experience and clinical outcomes act as secondary drivers through reputation and referrals, and ancillary services add capacity and incremental revenue. Together they reflect what FFS rewards: steady volume, efficient care, and clean billing. The gap between those incentives and the best outcomes for mothers and babies is exactly what value-based maternity models are designed to close.
This article is for general informational purposes only and is not legal, financial, or clinical advice. Benchmarks and reimbursement terms vary by payer, state, and contract.

The Numbers That Drive Hospital Maternity Care Under Fee-for-Service

Under fee-for-service, hospital maternity programs are run on volume, payment per birth, efficiency, and clean billing. Here are the metrics…

From HMOs to Homerooms: What Managed Care 101 Teaches Us About California’s Youth Behavioral Health Reform
HMO, PPO, EPO, capitation, value-based care — see how these managed care basics play out in real life through California’s…

Your Billing Problem Started in the Contract: What Revenue Cycle Leaders Need to Know Before a Claim Is Ever Filed
Most revenue cycle management challenges are treated as billing problems. In reality, many are contract problems — upstream issues that…

Doulas in Healthcare: A Smart Investment for Better Outcomes

From Ancient Wisdom to Modern Economics: The Case for Doulas in Healthcare Throughout human history, childbirth has been more than a…

The 2025 Healthcare Perfect Storm: How Rising Costs and Increased Scrutiny Impact Insurers
The blog post examines the health insurance industry’s challenges in 2025, highlighting rising healthcare costs, increased patient demand, and heightened…

From Startups to Shocking Bills: The Realities of Navigating Healthcare and Value-Based Care
In the latest episode of the VBCA Podcast, we explore the complexities, frustrations, and sometimes absurd realities of today’s healthcare…
Discover more from Healthcare Wiki
Subscribe to get the latest posts sent to your email.